IEW12 Presentation Graphs
A H Sparks and E M Del Ponte
2018-07-04
Source:vignettes/IEW12_slides.Rmd
IEW12_slides.RmdVisualise journals
rrpp %>%
  ggplot(aes(x = abbreviation,
             fill = art_class)) +
  geom_bar() +
  scale_fill_few() +
  labs(
    x = "Journal",
    title = "Random sample of 200 articles in 21 plant pathology journals",
    subtitle = "2012 to 2016",
    fill = "Article type"
  ) +
  theme(axis.text.x = element_text(angle = 45, hjust = 1))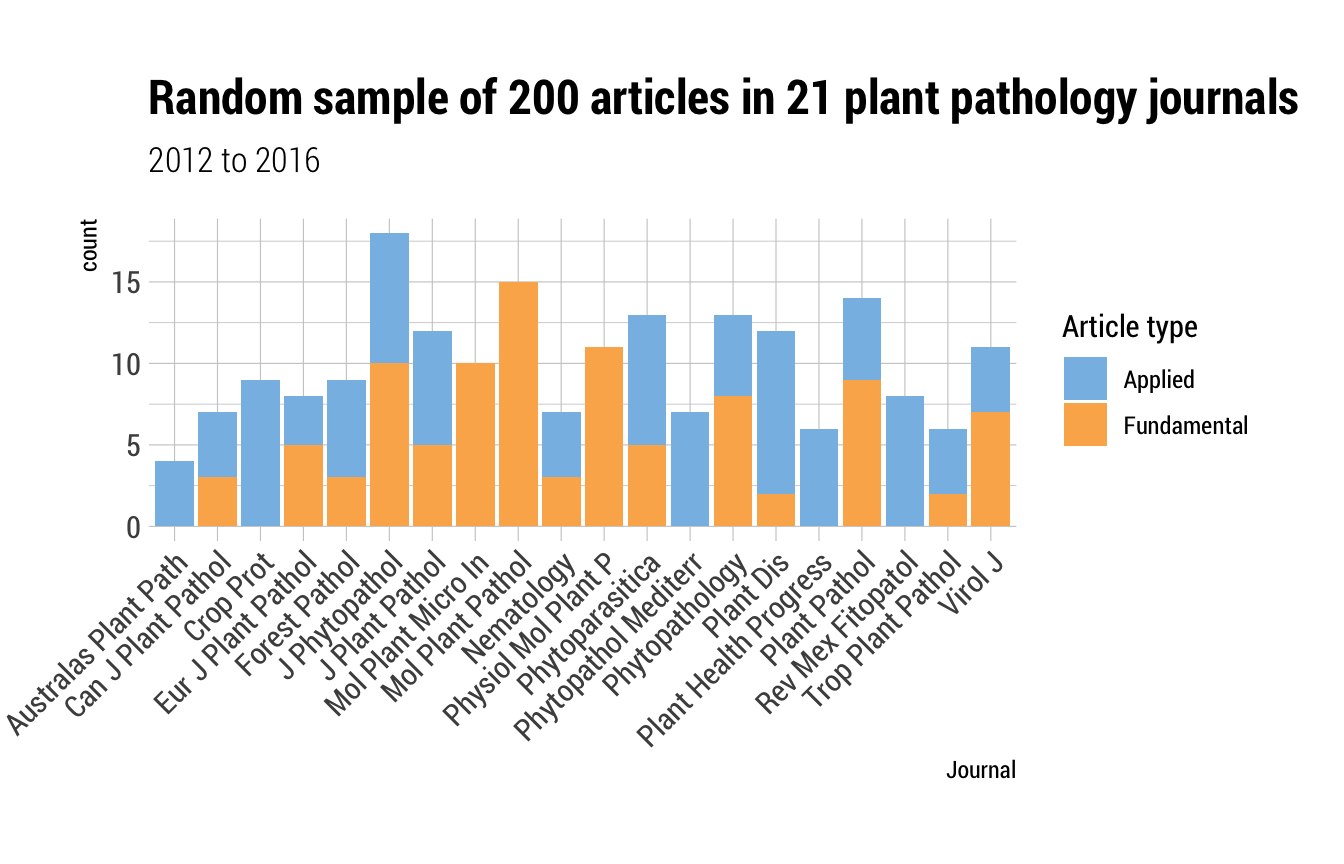
Visualise evaluations
Article classes
rrpp %>%
  ggplot(aes(x = art_class,
             fill = molecular)) +
  geom_bar() +
  scale_fill_few() +
  labs(title = "Article Classification",
       x = "Classes",
       fill = "Molecular")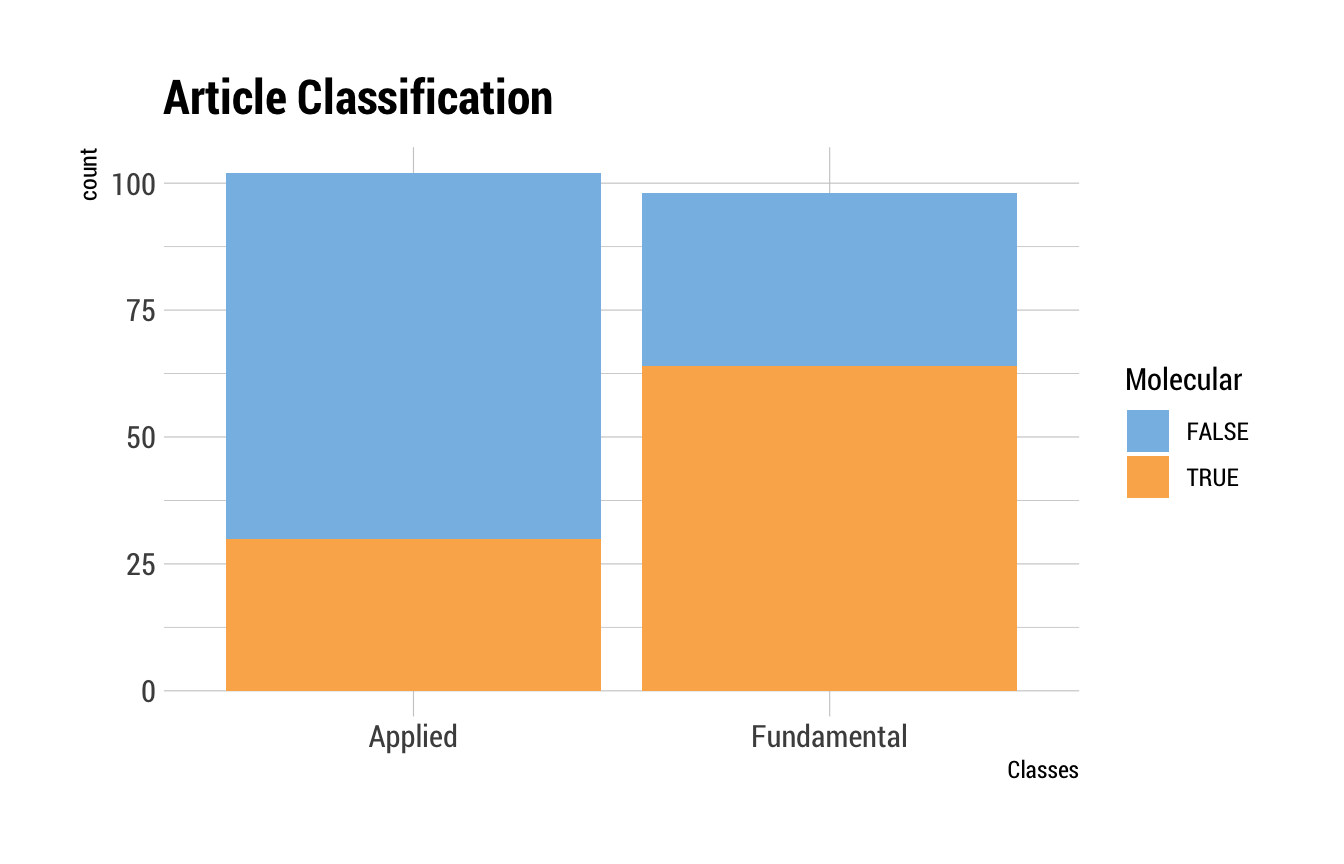
Computational methods available
Are analysis scripts and any special software used available for inspection and reuse to reproduce the work? Readily available (3) to not mentioned (1).
rrpp %>%
  ggplot(aes(x = comp_mthds_avail,
             fill = art_class)) +
  geom_bar() +
  scale_fill_few() +
  labs(title = "Computational Methods Availability",
       x = "Score",
       fill = "Article class")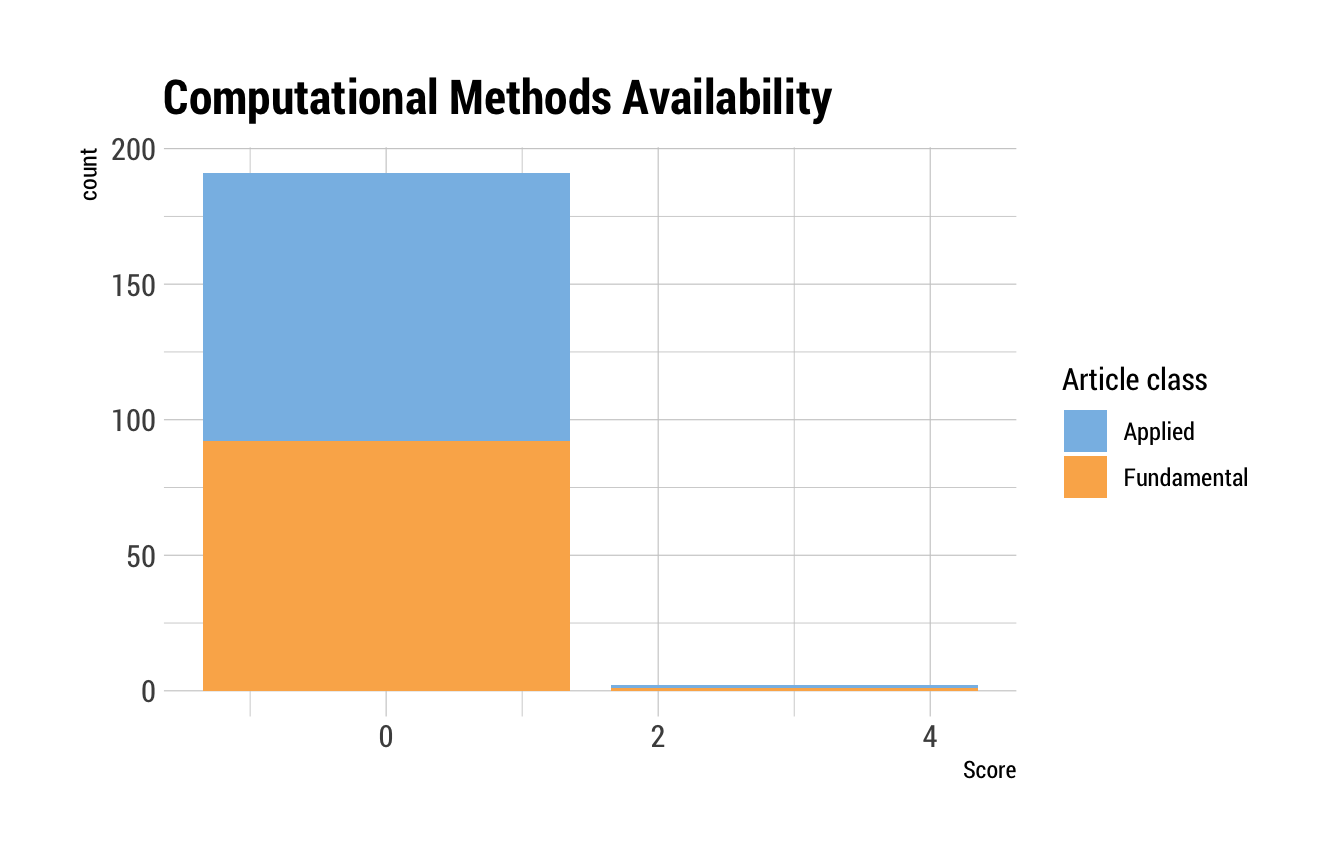
Software availability
Is the software readily available? Open source (3, good) to proprietary and $$ (1).
rrpp %>%
  ggplot(aes(x = software_avail,
             fill = art_class)) +
  geom_bar() +
  scale_fill_few() +
  labs(title = "Software Availability",
       x = "Score",
       fill = "Article class")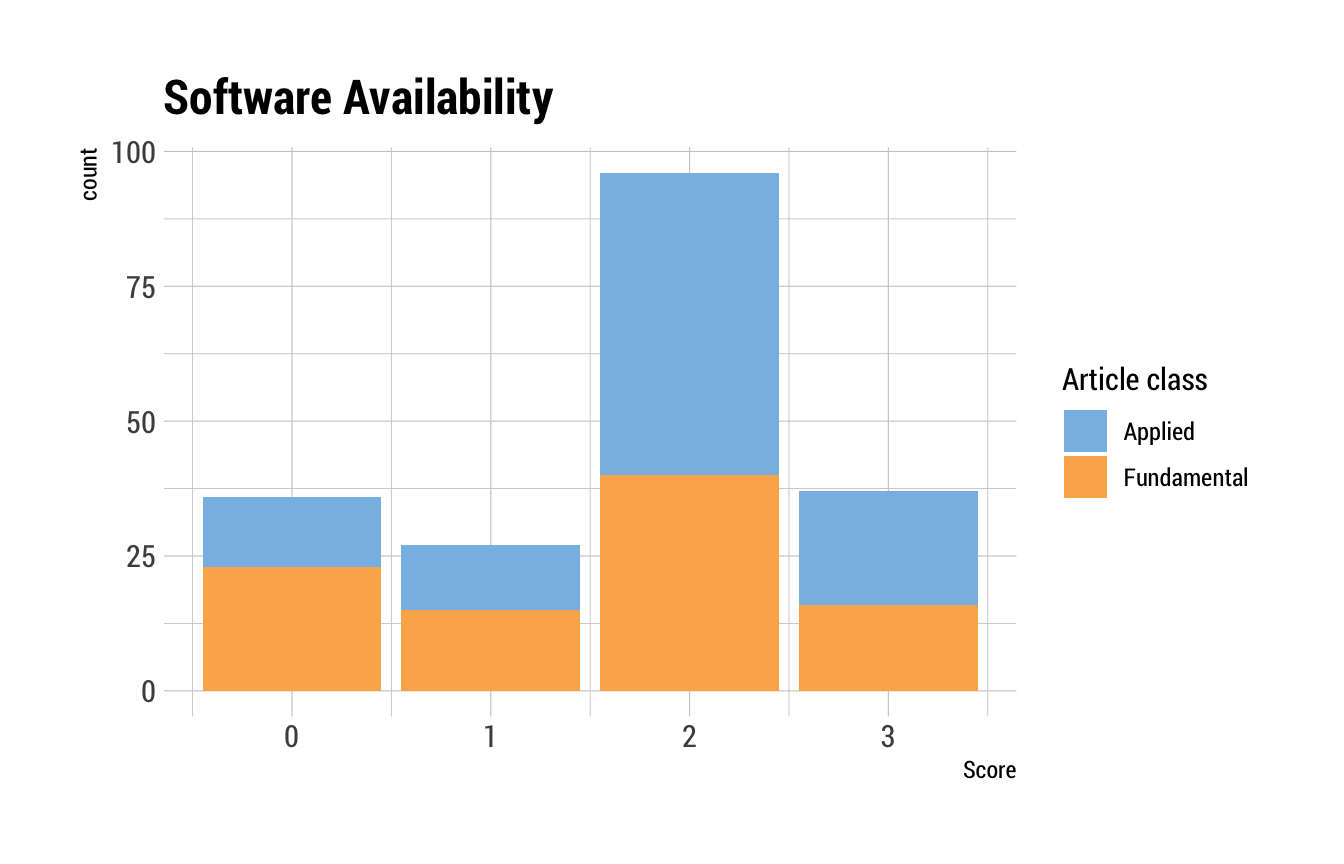
Data availability
Is the data readily available from a proper archiving repository, e.g. Zenodo or Dataverse (3) to not mentioned (1).
rrpp %>%
  ggplot(aes(x = data_avail,
             fill = art_class)) +
  geom_bar() +
  scale_fill_few() +
  labs(title = "Data Availability",
       x = "Score",
fill = "Article class") 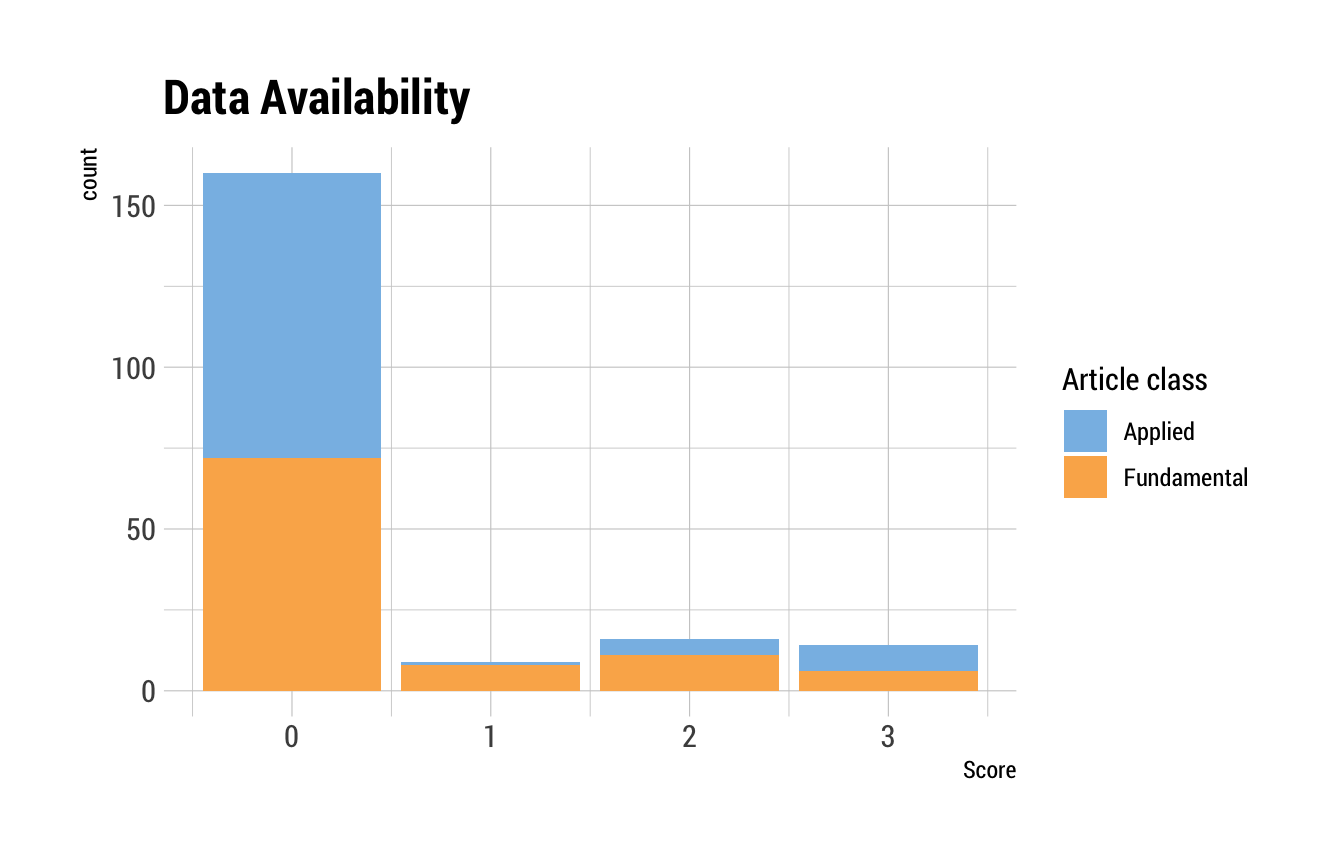
Software citations
Was the software used properly cited? All versions and packages cited (3) to not described what was used (1).
rrpp %>%
  ggplot(aes(x = software_cite,
             fill = art_class)) +
  geom_bar() +
  scale_fill_few() +
  labs(title = "Software cited",
       x = "Score",
fill = "Article class") 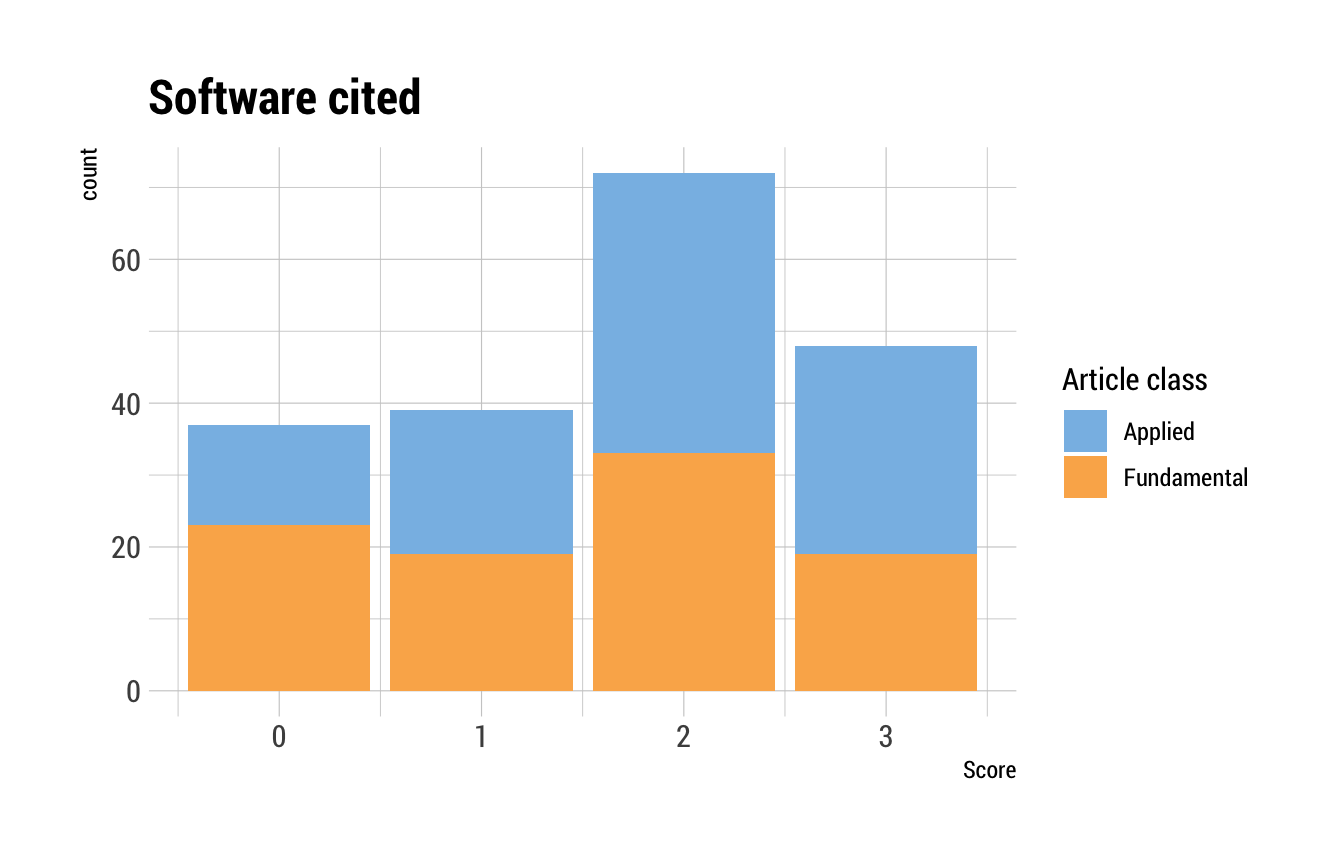
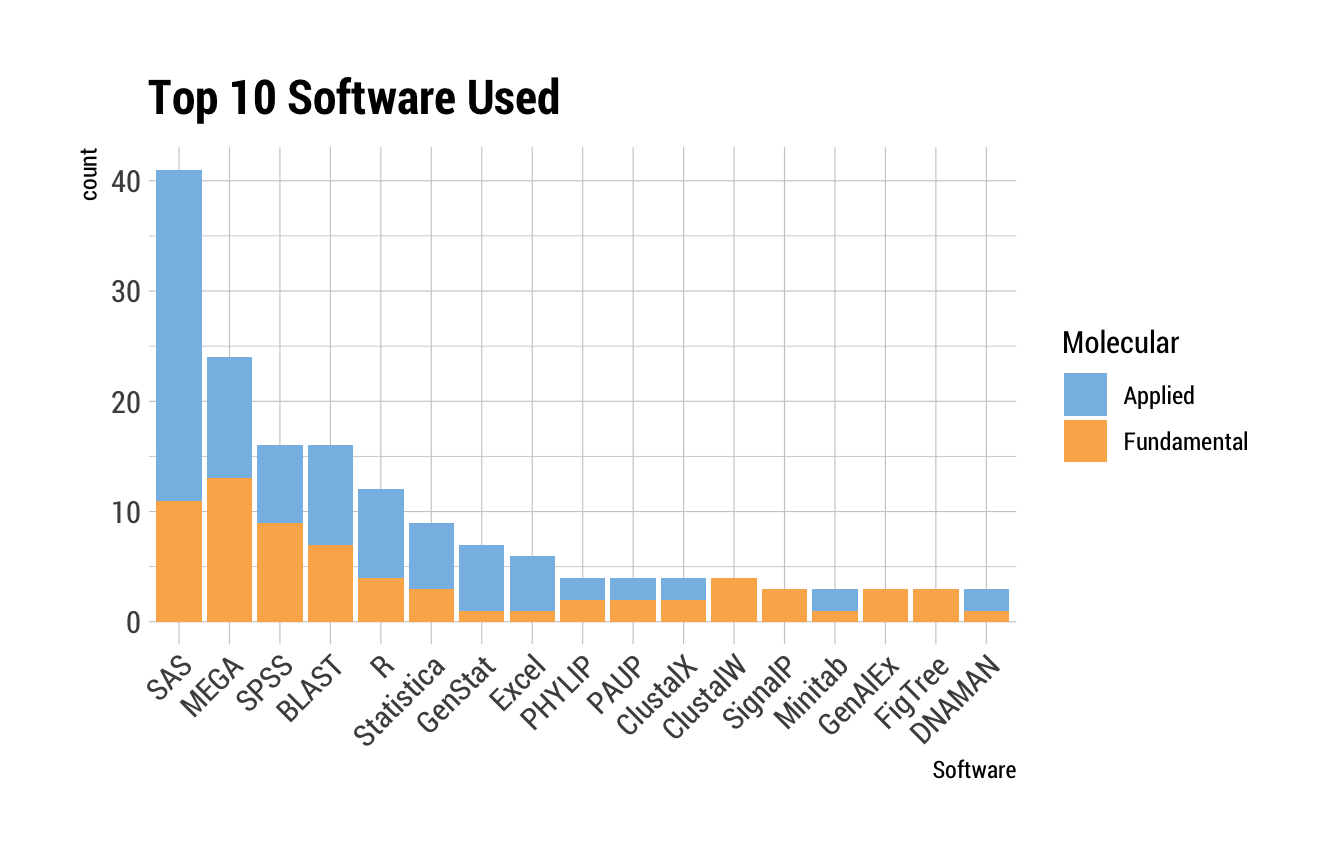
Software used (cited)
What are the 10 most popular software packages used?
Graph the software that were used
tab <- table(rrpp$software_used)
tab_s <- sort(tab)
top10 <-
  tail(names(tab_s), 17) # checking the table, there are several ties
top_software <- subset(rrpp, software_used %in% top10)
top_software$software_used <- factor(top_software$software_used,
                                     levels = rev(top10))
top_software %>%
  ggplot(aes(x = software_used,
             fill = art_class)) +
  geom_bar() +
  scale_fill_few() +
  labs(title = "Top 10 Software Used",
       x = "Software",
       fill = "Molecular") +
  theme(axis.text.x = element_text(angle = 45, hjust = 1))